
Global Cities Service
Make decisions about market and investment strategies with historical data and forecasts for 900 of the world’s most important cities.
Try for free
Overview
Our Global Cities Service provides detailed historical data and forecasts for 900 cities across the world. Cities are defined on a consistent basis, which allows direct comparisons to be drawn on their structure, performance and outlook. Information is provided for a broad range of economic and demographic indicators.
Detailed forecasts for global cities
Our Global Cities Service helps clients to make decisions about market and investment strategies, secure in the knowledge that they are comparing cities on a like-for-like basis.
Broad global coverage
Forecasts for 900 cities in 164 countries, consistent with our country and industry forecasts.

Extensive datasets for each location
Consistent and comparable annual data and forecasts for GDP and employment, demographics, income and consumer spending.
Long-term forecasts
The data generally refer back to 2000, and the forecast horizon is 2040.

Advanced analytical functions
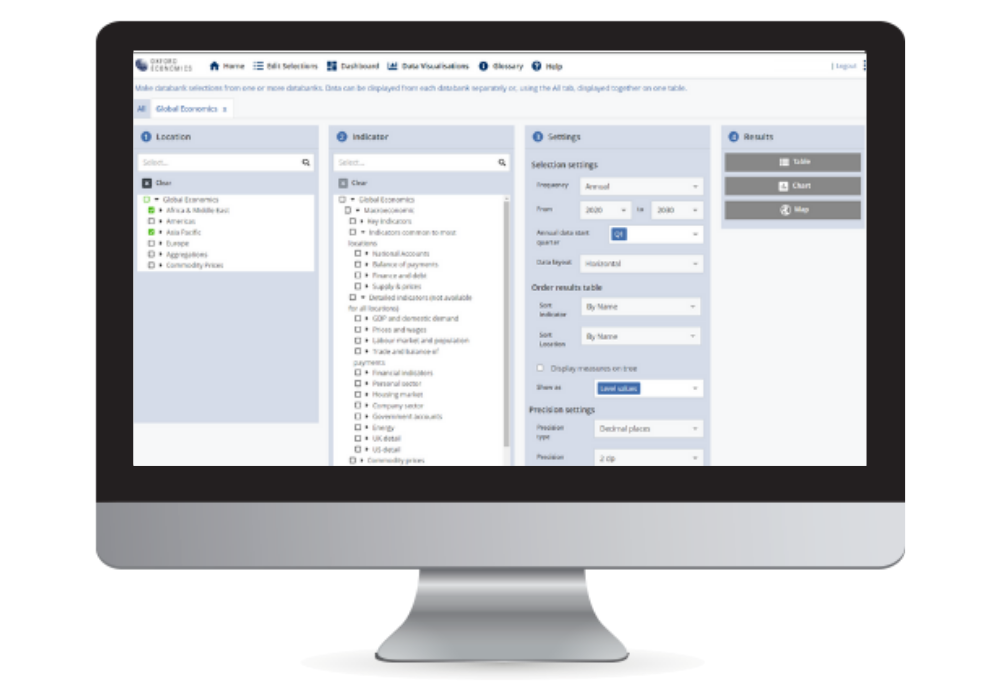
Our databank allows you to quickly build custom queries with a high level of flexibility.
Comparable data for all cities
Consistent definitions of cities, sectors, and income and spending profiles allow comparisons to be drawn between cities globally.

Service features
- Forecasts are accompanied by summary reports highlighting key messages.
- Web-based application and add-ins. Our Global Data Workstation is a web-based application that provides a variety of data selection, visualisation, and personalisation features.
- Our Excel Data Workstation is a simple but powerful add-in for accessing our data directly within Excel.
- Methodology report. Explanation of data sources, definitions and forecast methods.

Service benefits
- Better decisions, faster. Our Global Cities Service helps you to make the best decisions about market and investment strategies.
- Confidence. Our forecasts are derived from a consistent set of global economic, industry and city models and will help you to move forward with confidence.
- Excellent customer service. We offer our clients a comprehensive customer support with full access to our experienced economists and IT support team.

Indicators included and geographic coverage
The service covers 900 cities globally, including 102 in Africa, 29 in the Middle East, 324 in Asia, 232 in Europe, 202 in the Americas and the Caribbean, and 11 in Oceania.
Indicators included in the service are, besides others:
- GDP by sector
- Employment by sector
- Population by age cohort
- Income indicators
- Consumer spending by product/service
Please fill out the form below to request more information about the service and its coverage

Global Cities Service
Detailed economic forecasts to 2040 for 900 cities using consistent definitions of cities, sectors, demographics, and spending behaviour to allow comparison of the prospects and trends for cities across different continents. Clients can make top-level decisions about market and investment strategies, comparing like with like.

“Oxford Economics’ data and forecasts form the backbone of our demand models. The global consistency and granular detail available in their expansive dataset allows us to focus on the variables most relevant to our business.”
Resources and events

Research Briefing
UK : The everyday economy matters to local economic performance

Research Briefing
United States: Student loan payments are less concerning going forward

Research Briefing
UK: Supply constraints are probably less prominent in the south

Research Briefing
GCC: Key themes shaping city economies in the near term

Webinar
Cities in the medium term: we pick the likely winners and losers over the next five years

Webinar
Key themes for cities in 2024: Cities that will be driving growth in 2024

Webinar
Global Cities: Identifying opportunities amid long-term challenges

Webinar
Nordic outlook: Tighter monetary policy will weigh on activity
Global Cities: Identifying opportunities amid long-term challenges
Featured
Request a Free Trial
Complete the form and we will contact you to set up your free trial. Please note that trials are only available for qualified users.
We are committed to protecting your right to privacy and ensuring the privacy and security of your personal information. We will not share your personal information with other individuals or organisations without your permission.
Download the brochure for the Global Cities Service
Download
Related services

City Climate Analysis
In-depth insights into the economic impacts of climate change and mitigation policies on cities and local economies throughout Europe, the US and Canada.
Find Out More
European Cities and Regions Service
Regularly updated data and forecasts for 2,000 locations across Europe.
Find Out More
Asian Cities and Regional Forecasts
Key economic, demographic, and income and spending projections to 2035 for more than 400 locations across Asia-Pacific.
Find Out More
US States and Metro Service
Forecasts, scenarios and analysis for US states, metropolitan statistical areas and counties.
Find Out MoreTrusted By